
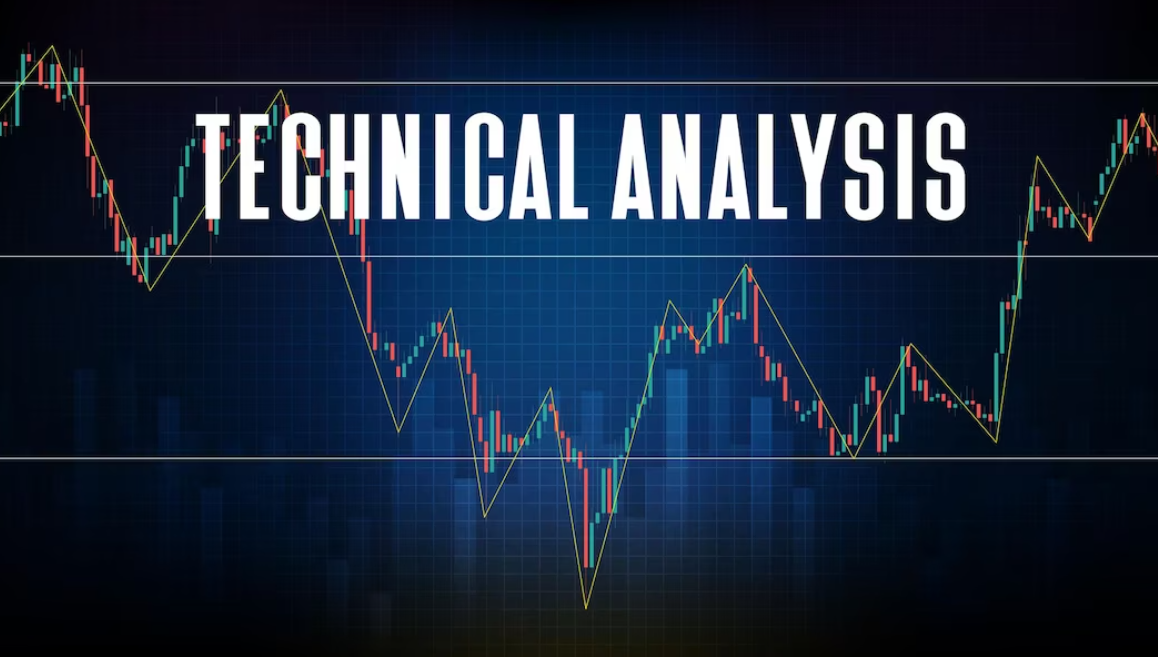
Trading decisions are often influenced by one important question: where is the market likely to move next? While nobody can predict future price movements with complete accuracy, traders use different methods to improve their decision-making. One of the most widely used approaches is technical analysis.
Technical analysis helps traders study historical price movements, market patterns, and trading activity to identify potential opportunities. Instead of focusing mainly on a company’s financial performance, technical traders analyze market behavior and use available data to understand possible future trends.
For beginners entering the trading world, learning the basics of technical analysis can provide a better understanding of how traders evaluate opportunities and manage their decisions.
What Is Technical Analysis?
Technical analysis is a trading method that involves studying price charts and market data to identify patterns and trends. The main idea behind this approach is that price movements often follow recognizable patterns because market behavior is influenced by human emotions such as fear, confidence, and uncertainty.
Technical analysts believe that historical price information can provide useful insights into future possibilities. By studying previous market movements, traders attempt to identify potential entry and exit points.
Technical analysis is commonly used in markets such as stocks, currencies, commodities, and other financial instruments.
Understanding Price Charts
Price charts are one of the most important tools used by technical traders. Charts display how the price of an asset has changed over a specific period.
Different types of charts provide different levels of information.
Line Charts
Line charts show the closing price of an asset over time. They are simple and easy to understand, making them useful for beginners who want to observe general price trends.
Bar Charts
Bar charts provide more information by showing opening prices, closing prices, and the highest and lowest prices during a specific period.
Candlestick Charts
Candlestick charts are among the most popular tools used by traders. They provide information about price movement within a particular time frame and help traders identify market patterns.
Candlestick patterns can show possible changes in market sentiment and help traders analyze buying and selling pressure.
The Role of Trends in Trading
Identifying trends is a major part of technical analysis. A trend represents the general direction in which a market or asset is moving.
There are three main types of market trends:
Uptrend
An uptrend occurs when prices generally move higher over time. Traders often look for opportunities to buy during an uptrend because market momentum is positive.
Downtrend
A downtrend occurs when prices consistently move lower. Traders may avoid buying during strong downtrends or look for opportunities based on their strategies.
Sideways Trend
A sideways market occurs when prices move within a specific range without a clear upward or downward direction.
Understanding trends helps traders make decisions that align with current market conditions.
Support and Resistance Levels
Support and resistance are important concepts in technical analysis.
Support is a price level where buying interest may increase and prevent prices from falling further. Traders often view support areas as possible points where demand becomes stronger.
Resistance is a price level where selling pressure may increase and prevent prices from moving higher.
Traders use these levels to identify possible entry points, exit points, and areas where price movements may change.
However, support and resistance levels are not guaranteed barriers. Markets can break through these levels due to strong buying or selling pressure.
Using Technical Indicators
Technical indicators are mathematical tools that traders use to analyze market information. These indicators help identify trends, momentum, and possible trading opportunities.
Some commonly used indicators include:
Moving Averages
Moving averages help traders understand the average price of an asset over a specific period. They are often used to identify trends and reduce the impact of short-term price fluctuations.
Relative Strength Index (RSI)
The RSI measures the speed and strength of price movements. Traders often use it to identify whether an asset may be overbought or oversold.
Moving Average Convergence Divergence (MACD)
MACD is used to analyze changes in market momentum and identify possible trend shifts.
No indicator can guarantee accurate predictions, but traders often combine multiple tools to improve their analysis.
The Relationship Between Volume and Price Movement
Trading volume represents the number of shares or contracts exchanged during a specific period.
Volume can provide additional information about market strength. For example, a price increase supported by high trading volume may indicate stronger buying interest.
On the other hand, a price movement with very low volume may suggest weaker market participation.
Many traders analyze both price and volume together to understand whether a market move has strong support.
Why Traders Should Not Depend Only on Technical Analysis
Although technical analysis is a valuable tool, it is not perfect. Markets are affected by many unpredictable factors, including economic news, company announcements, and global events.
A trader who relies only on charts without considering broader market conditions may miss important information.
Many experienced traders combine technical analysis with other approaches, such as fundamental analysis and risk management strategies.
Common Technical Analysis Mistakes
One common mistake among beginners is using too many indicators at the same time. Having multiple indicators does not always lead to better decisions and can create confusion.
Another mistake is believing that technical analysis can predict the market with certainty. Technical analysis provides possibilities, not guarantees.
Traders should also avoid changing strategies constantly. Developing skill requires practice, patience, and consistent evaluation.
How Beginners Can Learn Technical Analysis
Learning technical analysis requires time and practice. Beginners can start by understanding basic concepts such as trends, support and resistance, and chart patterns.
Studying historical charts can help traders understand how different patterns developed in past market conditions.
Many traders also use demo trading accounts to practice strategies without risking real money. This allows beginners to gain experience and improve decision-making skills.
Keeping a trading journal is another useful habit. Recording trade ideas, decisions, and outcomes helps traders identify strengths and areas for improvement.
Final Thoughts
Technical analysis is an important skill that helps traders understand market behavior and make more informed decisions. By studying price patterns, trends, volume, and indicators, traders can develop structured approaches instead of relying on guesswork.
However, successful trading requires more than just chart analysis. Risk management, discipline, and emotional control are equally important.
Technical analysis should be viewed as a tool that supports better decision-making rather than a guaranteed method for predicting the market. With continuous learning and practice, traders can improve their ability to analyze opportunities and manage risks effectively.